As yet another example of Trump-era fraud, climate information has been removed or buried to keep oil executives happy, and to give the president fantastic amounts of money in the process.
Trump warned us himself: in April 2024, at a dinner with oil executives, he told attendees they were wealthy enough to raise $1 billion for his campaign, and that in return, he would reverse President Biden's environmental regulations and stop new ones from being enacted. Campaign finance laws? Who cares. Grift? Who cares.
Climate change is not a hoax. Affordability is not a hoax. Trump is the hoax.
Climate Change: Evidence You Can See With Your Own Eyes
First, consider this:
After the infrastructure of fossil fuels is in place, it is still expensive to pump, transport, and burn this source of energy. After the infrastructure of renewables is in place, the energy itself is free. When the "Big Beautiful Bill" was passed, funding was cut for all renewable energy programs except geothermal and nuclear. Why would this be? The answer is obvious: it keeps us addicted to expensive, grid-level energy sources. Otherwise, the corporate profits of the fossil fuel industry would plummet.
Can you understand climate change without:
- Advanced math skills?
- Understanding of thermodynamics?
- Knowledge of history?
- Knowledge of astrophysics?
Answer: Yes. Absolutely yes.
The evidence requires only the ability to see photographs, understand simple before/after comparisons, trust basic measuring tools like thermometers and rulers, and accept that scientists worldwide can count and measure accurately.
Evidence You Can Literally See in Photographs
Glaciers Are Disappearing Before Our Eyes
No math is needed. No physics is needed. Just look at paired photographs showing the same locations decades apart.
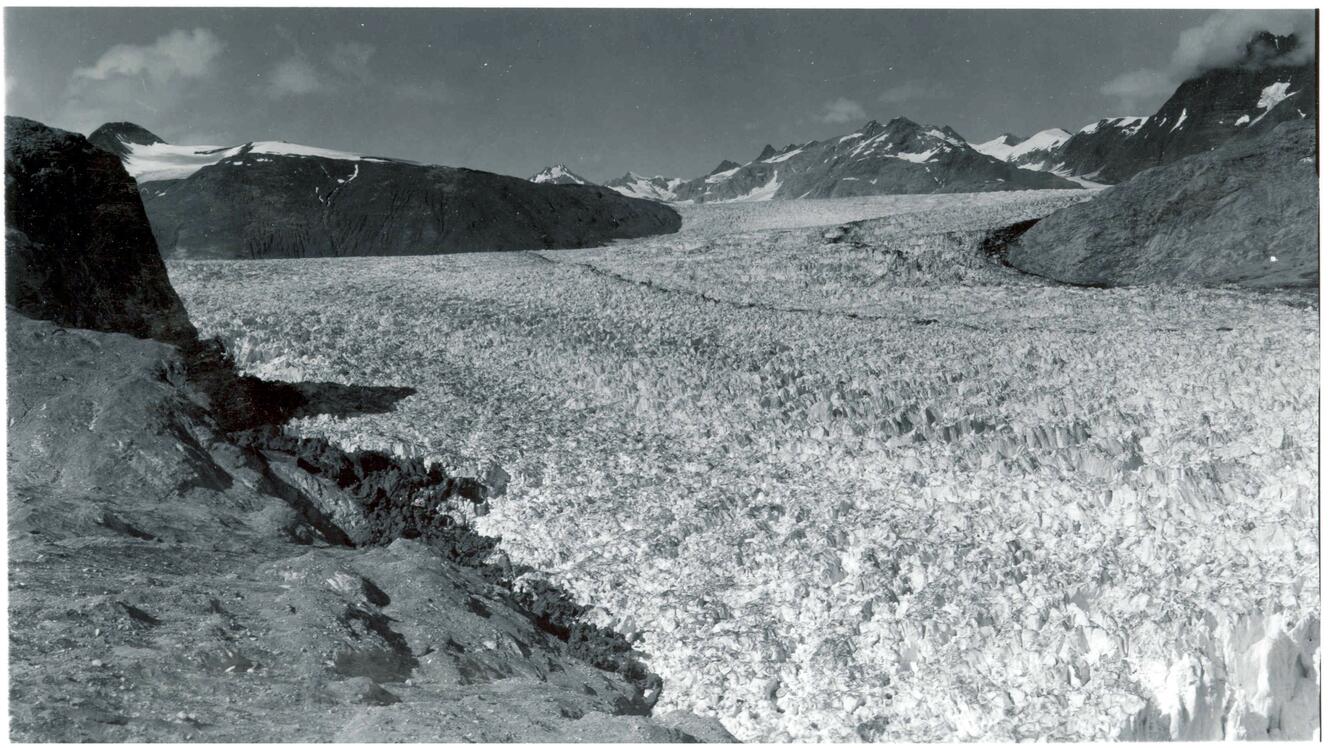
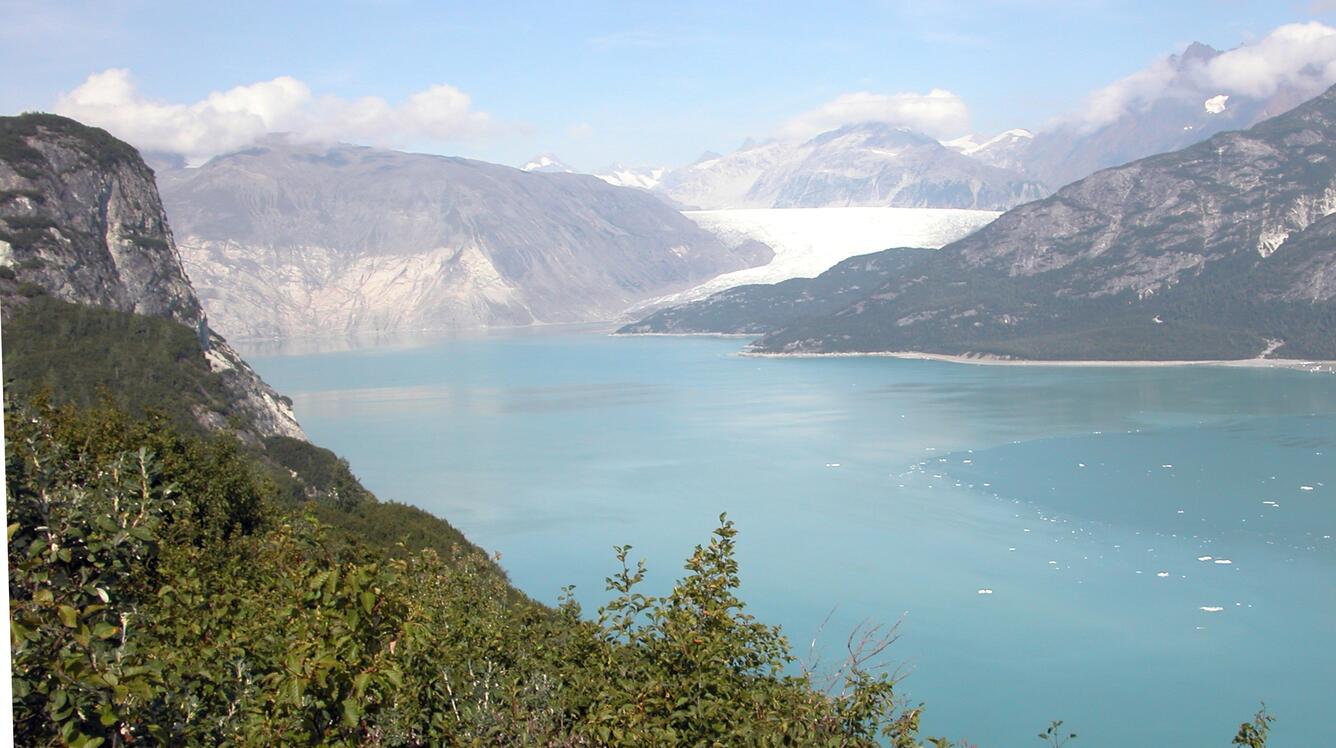
At Muir Glacier in Alaska, a 1941 photograph shows the glacier filling the entire inlet, with ice rising 300 feet above the water. By 2004, the glacier had retreated more than seven kilometers, or four miles, and is completely out of view. Dense vegetation now covers slopes that were bare in 1941.
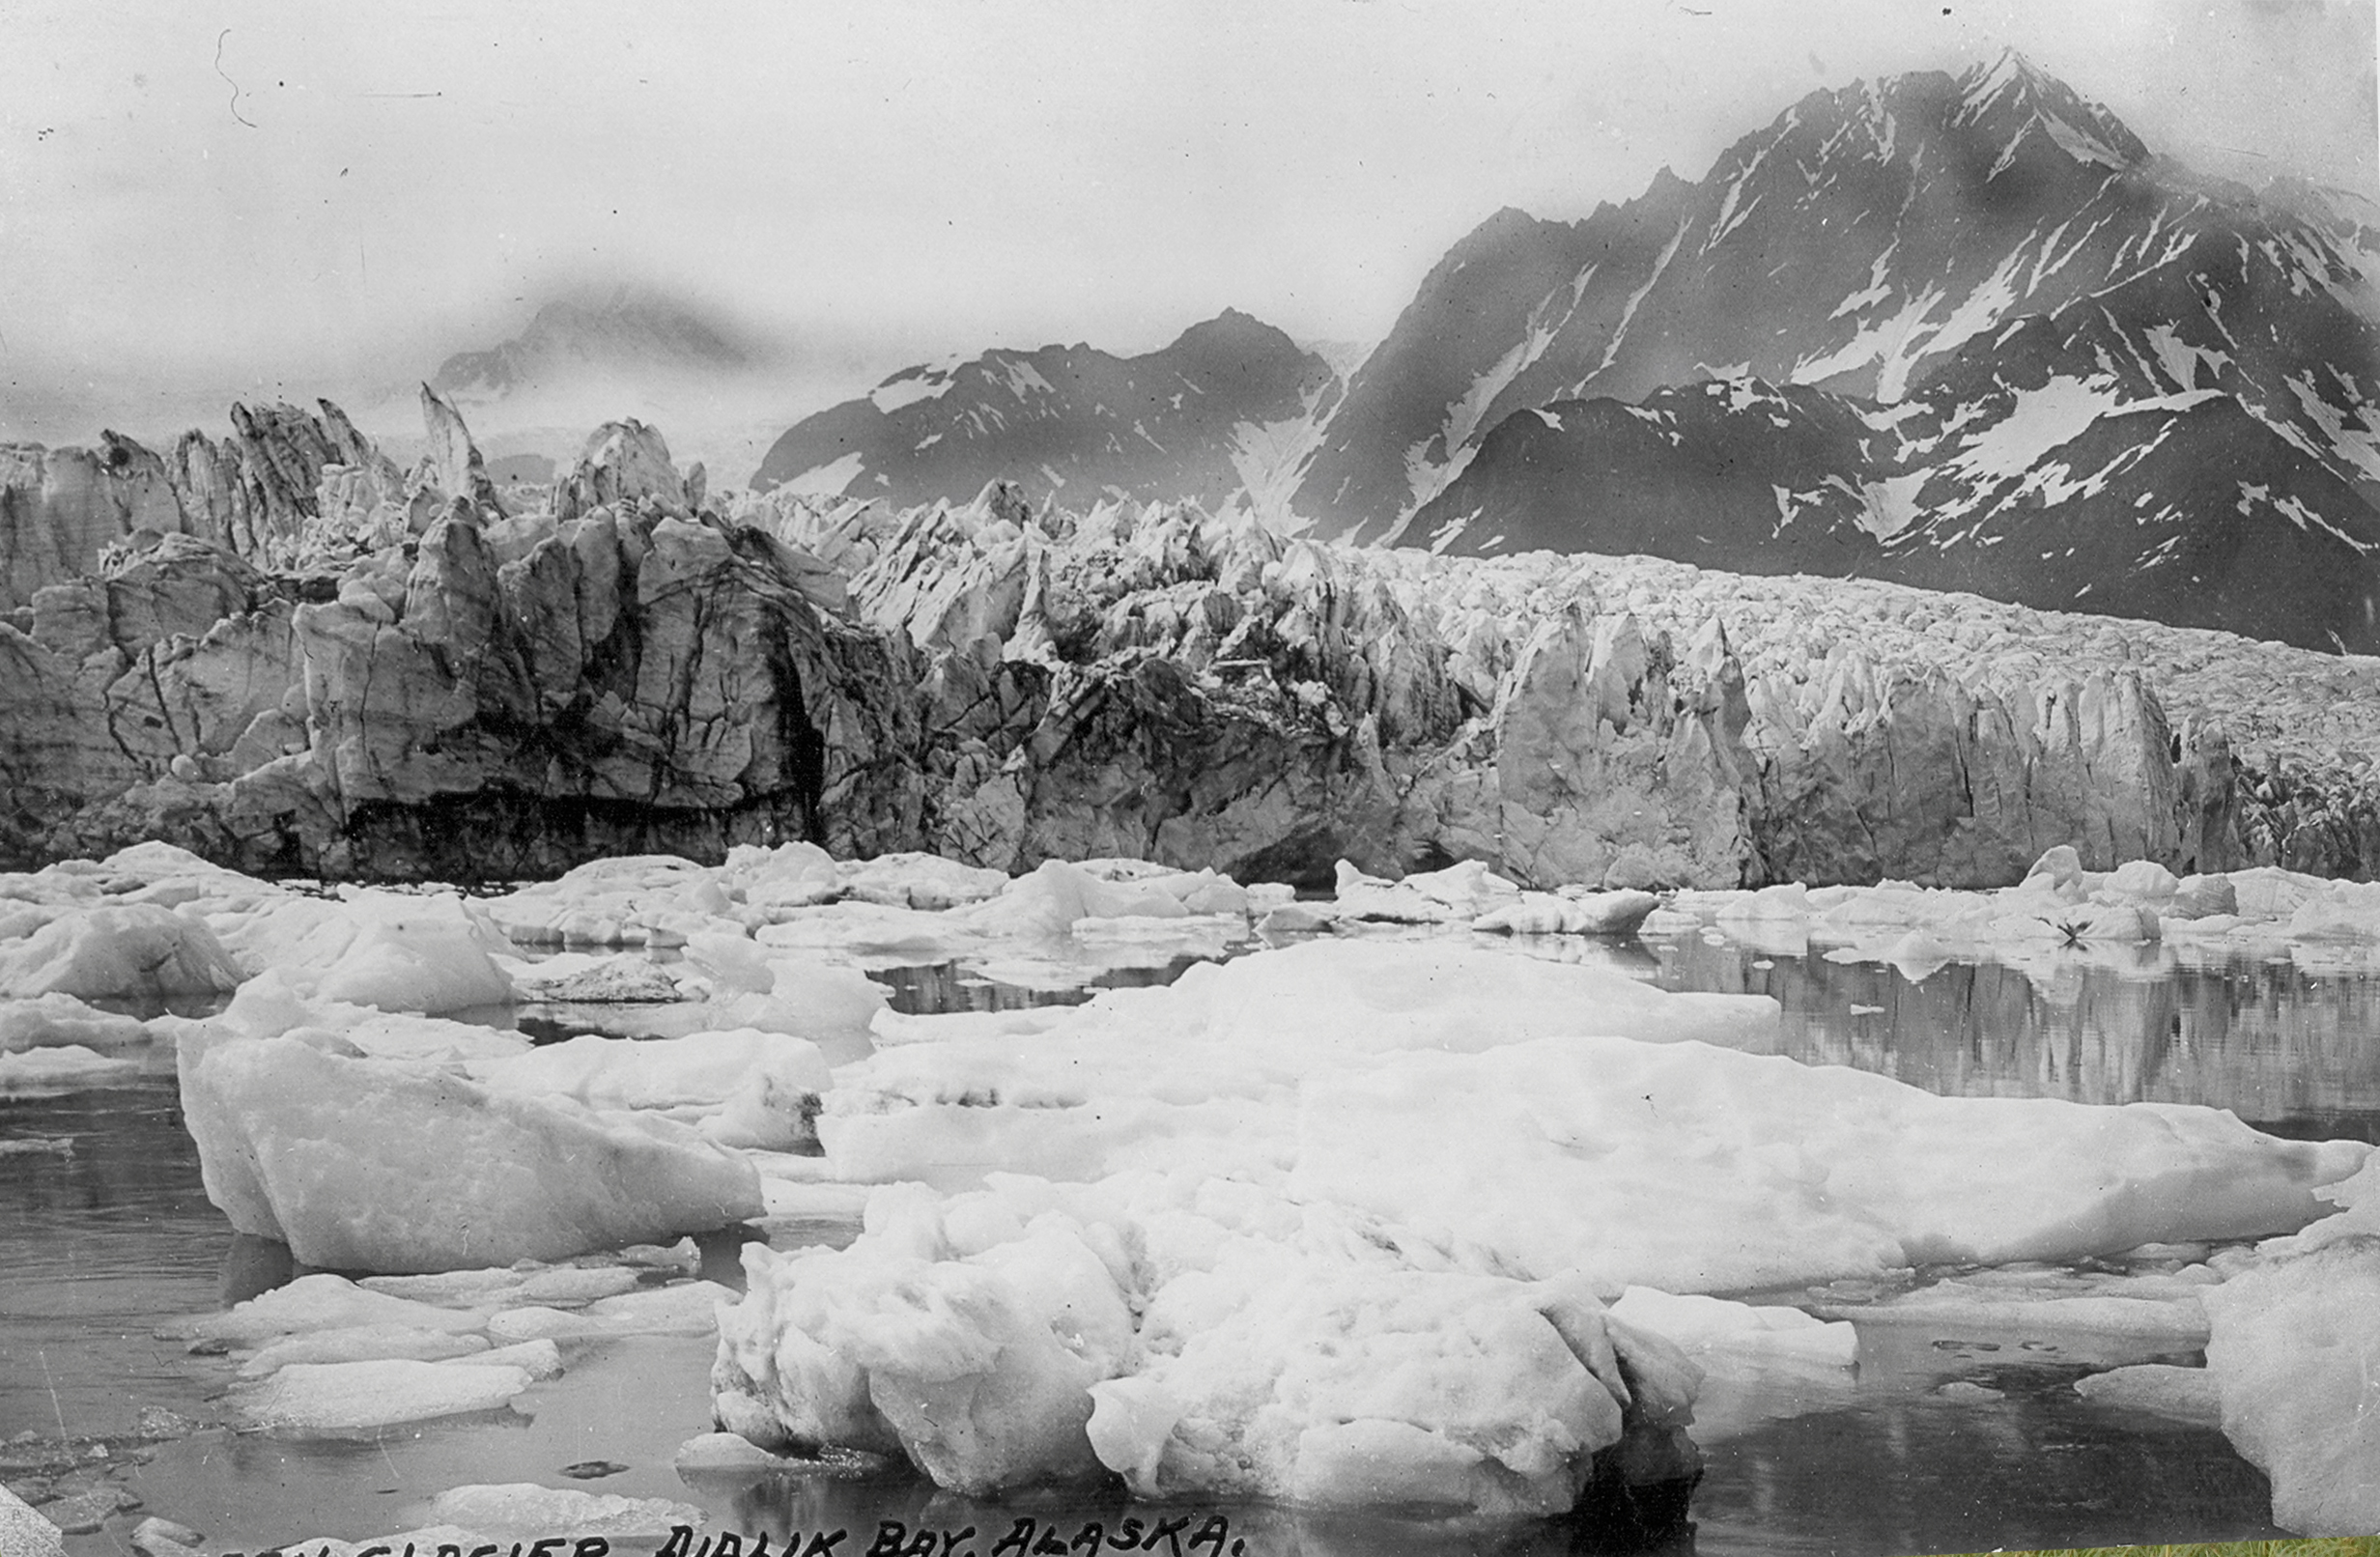
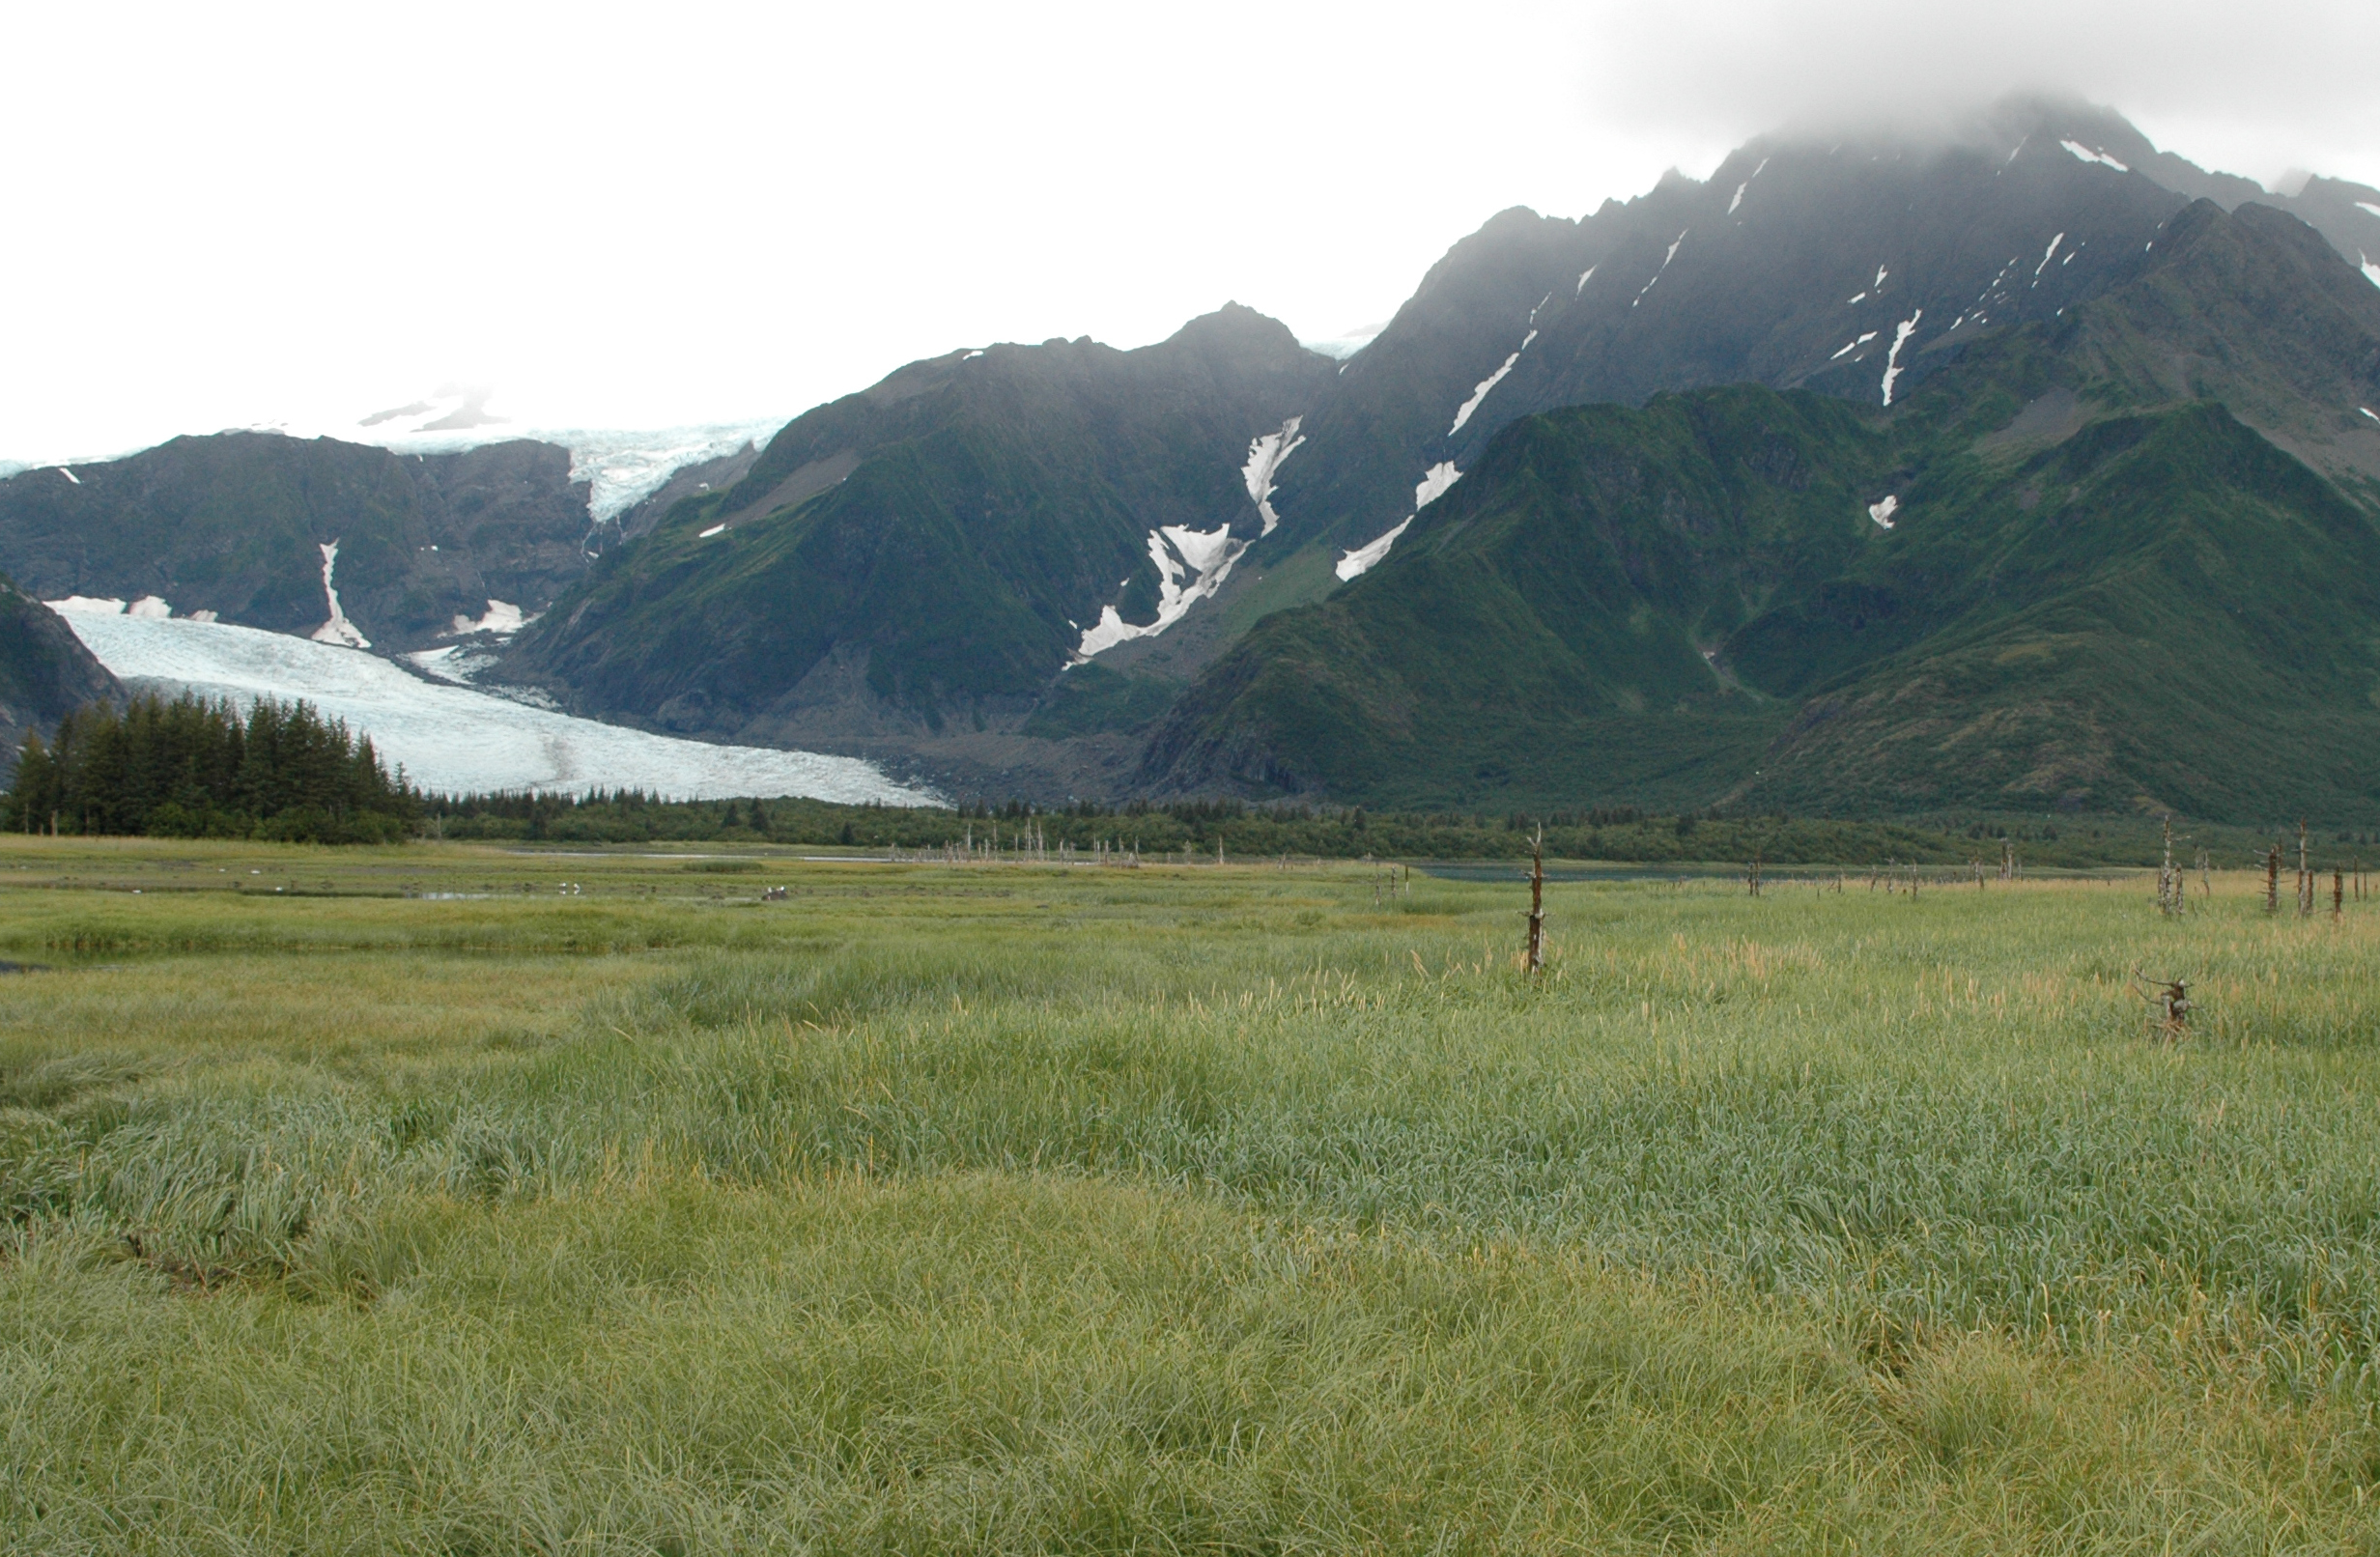
At Pedersen Glacier in Alaska, a 1920 photograph shows the glacier meeting the water and calving icebergs into the lagoon. By 2005, the glacier had retreated more than two kilometers, over a mile. The lagoon has filled with sediment and now supports grassland, shrubs, and trees. Where there was once ice, there is now a meadow.
Critical Fact: This isn't happening to just one or two glaciers. Scientists have measured approximately 200,000 glaciers worldwide, and nearly all of them are shrinking — in Alaska, the Alps, the Himalayas, the Andes, the Rocky Mountains, Africa's Mt. Kilimanjaro, New Zealand, Patagonia, Greenland, Antarctica, Iceland, and Scandinavia.
Measured Glacier Loss (2000–2019):
- Glaciers lost 267 billion tons of ice per year between 2000 and 2019.
- The rate of thinning has doubled, from 36 centimeters per year in 2000 to 69 centimeters per year in 2019.
- In 2023 alone, glaciers lost more ice than any other single year on record.
- Since 1975, glaciers have lost the equivalent of slicing a 98-foot (30-meter) thick layer off the top of each glacier.
Sources: World Glacier Monitoring Service, NASA, NOAA
Arctic Sea Ice Disappearing
You don't need to understand ice physics. You can see the ice vanishing in satellite photographs taken from space.
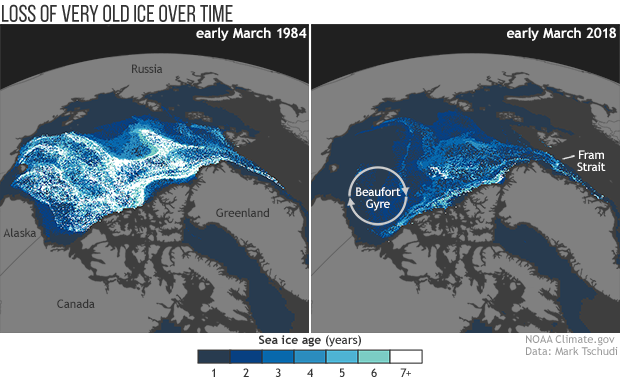
In the ninth week of 1984, multiyear ice comprised 61 percent of the Arctic sea ice pack. In the ninth week of 2018, multiyear ice comprised just 34 percent of the pack.
Arctic Sea Ice Facts:
- Since 1979, the Arctic has lost more than two million square kilometers of ice.
- September 2024 had the sixth-lowest ice extent on record.
- The last eighteen Septembers, from 2007 to 2024, were the eighteen lowest on record.
- Old ice, four years or more, has declined by 90 percent since 1979.
- Most Arctic ice is now thin "first-year ice" that doesn't survive the summer.
Sources: National Snow and Ice Data Center, NOAA, NASA
Temperature Rising — Anyone Can Read a Thermometer
You don't need to understand why heat happens. You just need to know that thermometers work. These are actual measurements from thousands of weather stations worldwide.
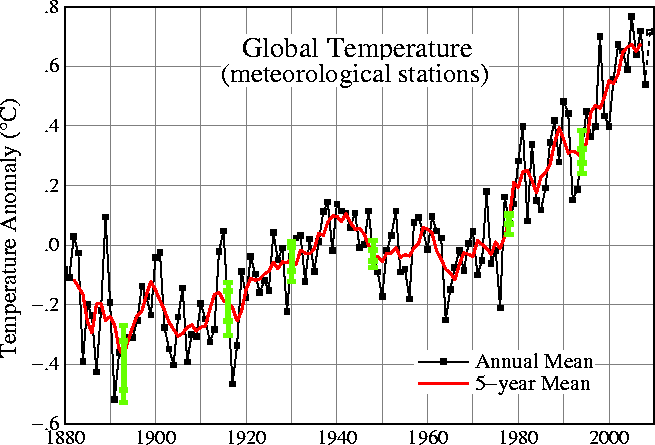
Actual measurements from thousands of weather stations worldwide, from 1880 to 2024, show temperature anomalies with a clear trend of increasing temperatures starting in the 1970s.
Simple Analogy: If you took your child's temperature every day for 100 years, and the readings got progressively higher, you wouldn't need to understand human biology to know something was changing. You'd just see the numbers going up, meaning it's getting warmer.
That's what's happening to Earth. Thermometer readings from thousands of locations worldwide, compiled by multiple independent organizations including NASA, NOAA, and universities around the world, all show the same thing: Earth is getting warmer.
Temperature Measurements:
- Since the late 1800s, Earth's average temperature has risen about 2°F (1°C).
- Since 1980, every decade has been warmer than the one before it.
- Most of the warming has occurred in just the past 40 years.
- 2024 was the warmest year on record.
- Rate of warming: approximately 0.15–0.20°C per decade since 1975.
Sources: NASA GISS, NOAA, multiple independent research groups
Sea Level Rising — Measurable with a Ruler
How We Measure Sea Level
Two Simple Methods:
- Tide Gauges: Installed at coasts worldwide for over 100 years. They work like measuring your child's height against a doorframe — ocean height is marked, year after year, at the same locations.
- Satellite Measurements: Since 1993, satellites use radar to measure ocean height from space, bouncing a signal off the ocean and measuring how long it takes to return. A higher ocean means a faster return signal.
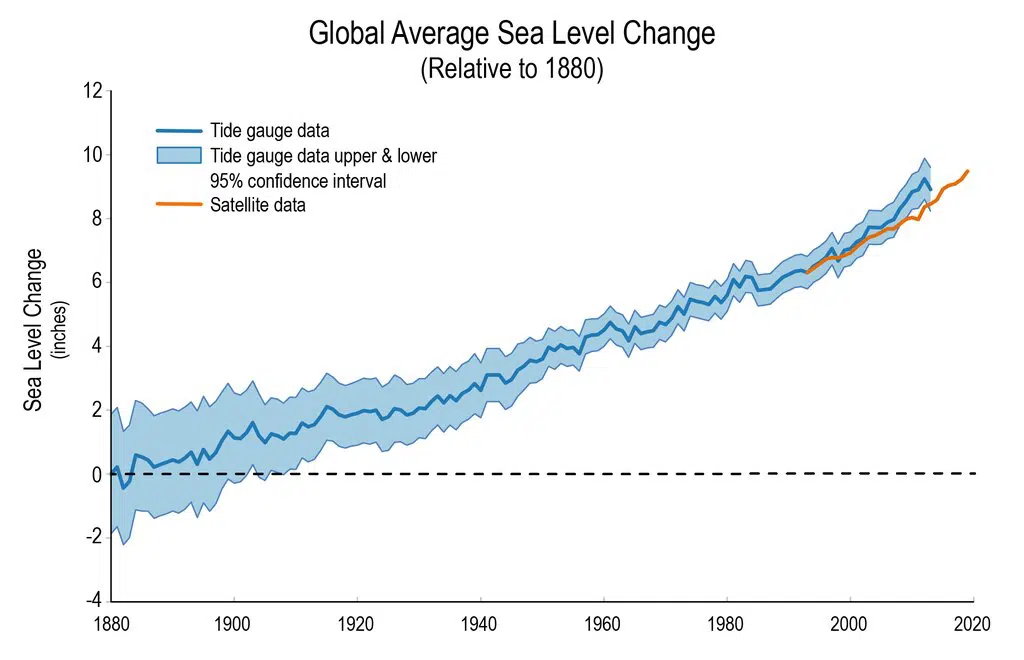
Sea level has risen approximately 8 to 9 inches (20 to 23 centimeters) since 1880. The rate of rise has doubled in the last 20 years compared to the previous century, and the rise is accelerating.
Where Is the Water Coming From? The simple answer is melting glaciers — water that was frozen on land is now liquid in the ocean.
Think of it this way: put ice cubes on a table, they melt, water runs onto the floor, and the floor is now wet. The same thing happens with ice on mountains, Greenland, and Antarctica: it melts, the water runs into the ocean, and the ocean is now higher.
No physics degree required.
Observable Changes Requiring No Expertise
- Animals Moving: Birds are migrating earlier; lobsters and other marine species are moving toward the poles, observed directly by fishermen and birdwatchers.
- Plants Changing: Plants are blooming earlier in spring, and growing seasons are longer — something anyone with a garden notices.
- Snow Cover Decreasing: Spring snow is melting earlier and mountain snowpack is smaller, noticed by ski resorts and visible in satellite photos.
- Ice Sheets Shrinking: Greenland lost 279 billion tons of ice per year between 1993 and 2019; Antarctica lost 148 billion tons per year.
- Ocean Chemistry Changing: Ocean surface waters are 30 percent more acidic since the 1800s, since CO₂ dissolves in water much like it does in vinegar.
The Common-Sense Argument
Imagine 200,000 ice cubes in your freezer. You come back a year later:
- 195,000 of them have shrunk.
- Only 5,000 are the same size or bigger.
- Water is pooling at the bottom of the freezer.
- Your thermometer shows the freezer is warmer than last year.
Question: Do you need a physics degree to conclude the freezer is warming?
No. You just need eyes to see the ice is smaller, a ruler to measure the shrinkage, a thermometer to measure the temperature, and basic logic that warmer means ice melts.
This is what's happening to Earth.
You Don't Have to Trust Scientists — Verify It Yourself
The Evidence Is Not Hidden:
- Photographs: Anyone can see before/after glacier photographs and verify they're real photos taken at the same location years apart.
- Measurements: Tide gauges, thermometers, and rulers are not complicated; scientists simply use more of them and record the numbers systematically.
- Multiple Independent Sources: NASA, NOAA, USGS, the European Space Agency, and universities in dozens of countries all find the same evidence independently — these organizations don't coordinate, they compete, and yet they all agree.
- Satellite Images: Anyone with internet can look at photos showing Greenland ice shrinking, Arctic ice declining, glaciers retreating.
Think about it: If you took your car to ten different mechanics and they all said your brakes were failing, would you believe them, or conclude that all ten are conspiring against you?
97% of climate scientists — analyzing thousands of published papers — agree that:
- Earth is warming.
- Human activities are the primary cause.
- This presents serious risks.
Source: Multiple studies in peer-reviewed journals
The Human Cause, Also Simple
Follow This Logic:
Step 1: CO₂ traps heat — known since the 1850s, and demonstrable in a simple lab experiment with two jars, one containing more CO₂, both in sunlight; the one with more CO₂ gets warmer.
Step 2: Burning coal, oil, and gas releases CO₂ — simple high-school chemistry: hydrocarbon plus oxygen equals CO₂, water, and energy.
Step 3: Humans have burned massive amounts since 1850, a documented history you can confirm just by counting cars, factories, and power plants.
Step 4: CO₂ in the atmosphere has increased from 280 parts per million in 1850 to 414 parts per million in 2020, measured directly through Antarctic ice cores for historical levels and direct measurements since 1958.
Step 5: Temperature has risen since 1850, correlating with the CO₂ rise.
Step 6: Other explanations have been ruled out: it's not the sun, whose output has slightly decreased; not volcanoes, which emit far less CO₂ than human activity; and not natural cycles, which don't explain the speed or pattern.
Conclusion: The timing, pattern, and physics all point to human-caused CO₂ as the driver.
Why the Speed Matters
"But hasn't Earth's climate changed before naturally?"
Yes — but this change is different because of its speed.
Speed Comparison:
- After the last ice age ended, Earth warmed roughly 4–5°C over 10,000 years.
- The current warming is roughly 1°C in just 150 years.
- Current warming is roughly ten times faster than natural post-ice-age warming.
Analogy: Getting older is normal. Aging ten years in one year indicates a serious problem.
The speed of change is what makes it dangerous. Ecosystems, agriculture, and infrastructure can't adapt fast enough.
Why This Matters
- Coastal Flooding: Higher sea levels mean coastal cities flood more often — already happening now in Miami, Venice, Bangladesh, and the Pacific islands.
- More Intense Weather: Warmer air holds more water, meaning heavier rainfall and more floods; warmer oceans mean more intense hurricanes.
- Water Supply Problems: Many cities rely on mountain snowpack melting in summer for water. Less snow means less summer water for drinking, agriculture, and power.
- Agriculture Changes: Growing seasons and rainfall patterns are changing, and droughts are worsening — affecting food supply and prices.
- Economic Costs: Coastal damage, disaster recovery, and infrastructure adaptation cost billions of dollars — affecting taxes, insurance, and property values.
The Bottom Line
You do not need:
- Math skills beyond basic arithmetic
- Understanding of thermodynamics
- Knowledge of atmospheric physics
- Historical expertise
- Astrophysics knowledge
You only need:
- Eyes, to see photographs showing change
- Trust in basic measuring tools, like thermometers, rulers, and scales
- Basic logic — if ice melts, water level rises
- Acceptance that scientists worldwide can count and measure
- Common sense — if 200,000 glaciers are melting, something is happening
The evidence is:
- Visible, in photographs
- Measurable, with simple instruments
- Worldwide, not one location
- Consistent, across every data point
- Accelerating, not slowing down
The glaciers were there. Now they're not.
The sea level was here. Now it's higher.
The temperature was this. Now it's warmer.
These are facts, not opinions.
These are measurements, not predictions.
These are observations, not theories.